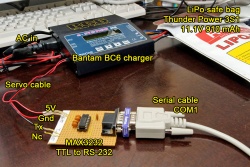
Bantam data cable
To make a Bantam data cable, only a few things are needed. The part cost is small and the software is free (donationware).
Parts
- 1x Servo cable
- 1x RS-232 cable, either USB or Serial, like this one, part number TTL-232R-5V (thanks Marc).
- Or build your own:
Build
The BC6 has a port on the left side of the unit for data output. It's a TTL stream and a RS-232 transceiver is needed to make it more understandable for a computer.
Pin-out seen from the left side:
- Pin 1 - 5V (left)
- Pin 2 - Tx signal (middle)
- Pin 3 - Gnd (right)
Connect the Tx signal to the Tx input on the RS-232 adapter, 5V to 3/5V power output, and Gnd to ground.
Connect the RS-232 adapter to the computer via either USB or Serial. The next step we're going to use the serial port (COM1, COM2, COM3, etc) to capture the data coming in from the charger.
Software
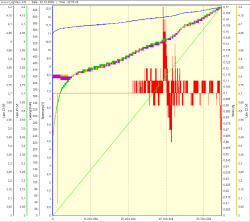
File:Helicopter logview overview.png 
Forunately a gentleman called Dominik Schmidt has created a Windows based monitoring application called LogView especially built for battery chargers and data loggers. It has profiles for a range of different manufacturers and models, including the Bantam models.
The program splits the incoming serial data in graphics showing the charging voltage, cell voltage, input power, wattage, temperature, and energy usage.
A driver might be needed if you use a USB serial adapter.
Once downloaded and installed, select your charger and try a random COM-port. Click 'Start recording' and start charging a battery. The graphs should begin to grow immediately. When the charging is done, save the graphics and data log for later reference.
Try playing around with the difference views in the View-menu and graphs on the left-side.
